The result shows a worrying trend in increased transport costs and led to calls for government change to transport policies, said the AAA chief executive Michael Bradley.
“The AAA’s latest Transport Affordability Index shows transport cost pressures continue to grow and should act as a reminder to all governments that policy must be designed and reviewed to minimise pressure on household budgets,” he said.
Nationally, transport costs also increased as a percentage of income over the quarter to December, from 13.4 per cent to 13.6 per cent.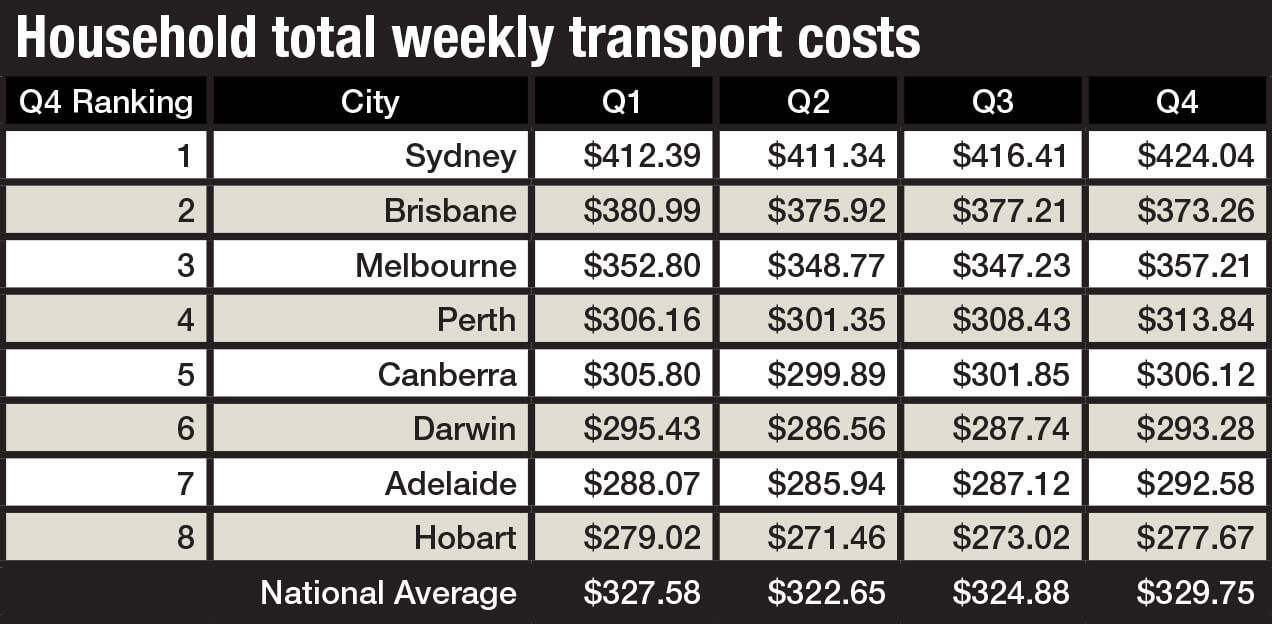
By comparison, ABS figures show that household expenses relating to electricity and gas consume one to three per cent of household budgets.
The latest Transport Affordability Index from the AAA and SGS Economics and Planning, shows that a typical, two-car Sydney family pays about $22,050 a year in travel costs, up from $21,653 in the previous quarterly study.
That means the average Sydney family with two cars now pays $424 a week for transport, compared with their counterparts in Brisbane ($373 a week) and Melbourne ($357 a week).
In its latest quarterly report for the December period in 2016, the AAA said tolls “contribute heavily to the weekly transport costs of families in these three cities”.
“Without tolls, Melbourne would be overtaken by Perth as the third most expensive city for transport, while Sydney and Brisbane would nevertheless remain at the top of the rankings,” it said.
Tolls averaged $78.04 in Sydney, $46.00 in Melbourne and $48.90 in Brisbane for the 2016 calendar year. The figure is based on one car per family using the toll roads. There are no tolls roads in Adelaide, Hobart, Perth and Darwin and Canberra.
The index, commissioned by the AAA and developed by SGS, tracks transport affordability by analysing tax, tollways, public transport, insurance, maintenance, fuel and finance costs as a proportion of average household income across states and territories.
It said that rising fuel costs were also making a dent in weekly expenses, rising to a national average of $61.83 a week in the December quarter compared with $57.32 in the March quarter.
In the latest quarter, the most expensive city for weekly fuel costs was Hobart ($63.35) and the cheapest was Adelaide ($60.07). Both Sydney and Melbourne cost motorists an average of $61.40 a week in the December quarter.
Away from the private car, public transport costs showed that using the bus or train in the December quarter was the cheapest in Darwin ($20.00 a week) followed by Hobart ($25.60). The most expensive was Sydney ($59.04) followed by Perth ($55.30).
The index noted that Brisbane recorded a decrease of almost $12 in the weekly cost of public transport for the hypothetical household, corresponding to a saving of more than $600 per year. The decrease was a result of changes made by the Queensland State Government to fares and zoning.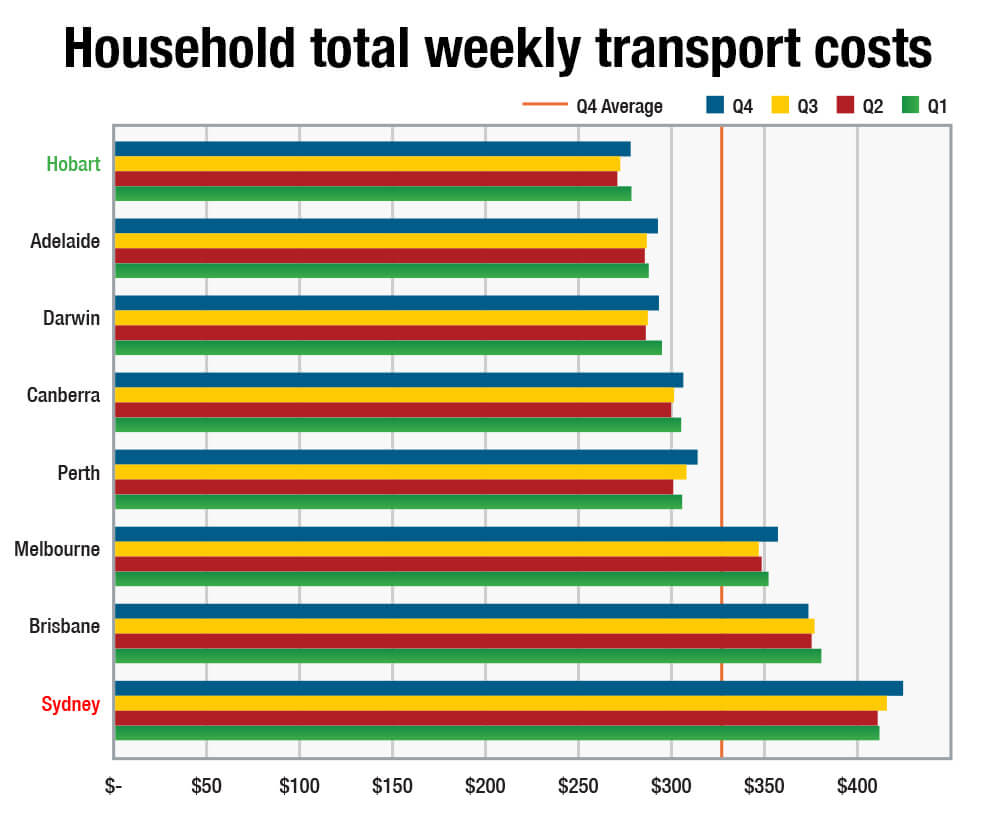
It moved Brisbane from the most expensive to the third-most expensive capital city for public transport.
While transport costs were rising, the cost of owning a car was falling. The AAA data from 2016 as published by the RAC in WA said that operating costs were down compared with calendar 2015 because of lower interest rates and competitive new-car pricing.
It surveyed 125 vehicles and reported that the average cost of running and owning a new car was $207.86 in 2016 – the latest period surveyed – compared with the 2015 average of $214.35 a week.
The single biggest cost was depreciation that made up to 40 per cent of the cost of running a new car for five years. That was followed by on-road costs (including stamp duty, registration and compulsory third-party insurance) and private car insurance.
The Transport Affordability Index is based on the incomes and transport costs of a hypothetical household in each capital city that consists of a couple with children and two cars, the average household identified by the 2011 Census.
Summary of findings – Quarter 4, 2016:
- The largest transport cost increases occurred in Sydney and Melbourne at $397 and $519 respectively per year. In both cases, the greatest increases in any single category were in fuel.
- A typical family in Sydney is paying around $22,050.30 (up from $21,653.29 in Q3) while the annual cost of land transport is lowest in Hobart at $14,438.71 (up from $14,197.07 in Q3).
- A typical two-car Sydney household faces weekly transport costs of $424 — or $22,050 per year — ahead of Brisbane and then Melbourne at $19,409 and $18,575 per year respectively.
- In Perth and Canberra, weekly transport costs were $314 per week and $306 per week respectively.
- Brisbane was the only capital city to experience a fall in average annual transport costs, down from $19,614.76 to $19,409.29. Due to a new fare and zoning structure, public transport costs in Brisbane fell by more than $600 per year for the hypothetical family. This decrease was, however, partially offset by increases in other categories.
- Transport costs in the lower-income, lower-density cities of Adelaide and Hobart accounted for 13.5 per cent and 14.6 per cent of household budgets respectively.
By Neil Dowling






 Read More: Related articles
